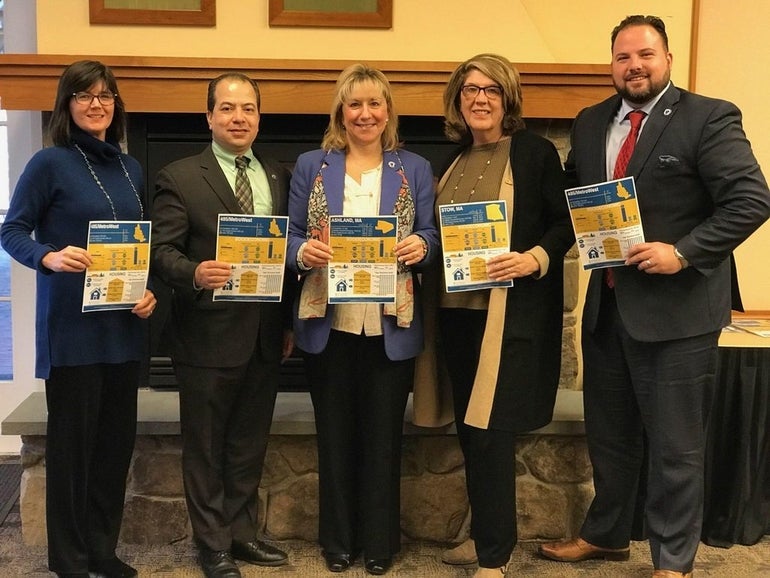
A new report from researchers at UMass Dartmouth paints a detailed picture of a MetroWest region richer and better educated than the state as a whole, and an area fast-growing and diversifying.
By nearly every major measure, the 35-community region outshines the rest of the state, according to research from the UMass Dartmouth Public Policy Center, which released its report in January.
A look at highlights of the 42-page report:
• The region’s population grew by 5.6 percent from 2010 to 2015, outpacing the statewide rate of 1.7 percent. A few communities accounted for a large chunk of that growth. Franklin grew by 3,587 residents during that time, Natick by 3,256 and Framingham by 2,891.
• The MetroWest population is more educated than the state’s population as a whole, with 54.8 percent of the region holding a bachelor’s degree or higher, compared to 40.5 percent statewide. The communities with the highest rates of college degrees are Wayland, Acton, Sherborn, Boxborough and Sudbury.
• The area is wealthier than the rest of Massachusetts, with household median income above $100,000. Sudbury had the highest median household income in 2015 ($165,745), followed by Sherborn ($155,956) and Bolton ($147,446). Framingham, Milford and Marlborough are the relative poorest, though they’re still about at the statewide average.
• The area has consistently had a better unemployment rate than the statewide average since 1990. In November, it was 2.8 percent compared to 3.3 percent.
• MetroWest is still overwhelmingly white, at 85.1 percent, but it’s diversifying. The rate of residents who identify as white fell by 6.5 percentage points between 2000 and 2015. The communities with the most diversity are Boxborough, Shrewsbury and Westborough, which have large Asian populations, and Framingham and Marlborough, which both have a higher rate of minorities more broadly.
• Homes in MetroWest are pricier than the rest of the state, and help contribute to the Boston region’s reputation as one of the most expensive in the country. The median single-family home price in the region is $400,820, compared to $353,000 statewide. Still, sale price and volume have yet to return to pre-recession levels, which peaked in 2005. The number of building permits issued each year is also nowhere close to where it was in 2005.
• Wayland, Sudbury, Sherborn and Medfield have the most expensive houses, with each having a median price of over $600,000. The biggest increase in property values since the recession have been in Northborough and Littleton.
• Worcester has more MetroWest workers as residents than any other community, including Boston, Framingham or any MetroWest community. It doesn’t work the other way around, though. Of MetroWest residents working outside the area, Boston has the most workers. Worcester is a distant third, after Framingham.
• The job sectors with the most job growth from 2010 to 2015, in absolute numbers, were computer systems design, individual and family services, and restaurants and food service. Computer systems design is also the sector forecasted to have the most growth in the next decade, followed by home health care services.
The 495/MetroWest Suburban Edge Community Commission, which was established by the legislature in 2015, voted on Jan. 26 to adopt the report’s findings for regional planning.

