
Calendar year 2024 was shaping up to be a 2020 rematch of former Republican President Donald Trump and incumbent Democratic President Joe Biden. With President Biden withdrawing from the race and Vice President Kamala Harris seemingly receiving the Democratic nomination, uncertainty around the November election is rising. Given the backdrop of today’s polarized political environment, it may be leaving investors worried about the implications for their investment portfolios.
In any year there are risks, themes, and events that investors need to consider when making informed investment decisions. Unfortunately, during years with Presidential elections many investors tend to focus entirely on the results in November.
Should investors stay the course? Should they move to cash and wait out the election results? What does history tell us about returns in an election year? Let’s see what the data tells us.
The chart below shows calendar year price returns for the S&P 500 between 1951 and 2023, with green bars representing non-election years and red bars representing election years. Over this period there have been eighteen election years, with an average annual price return of 7.26%, compared to 55 non-election years, with an average annual price return of 9.73%.
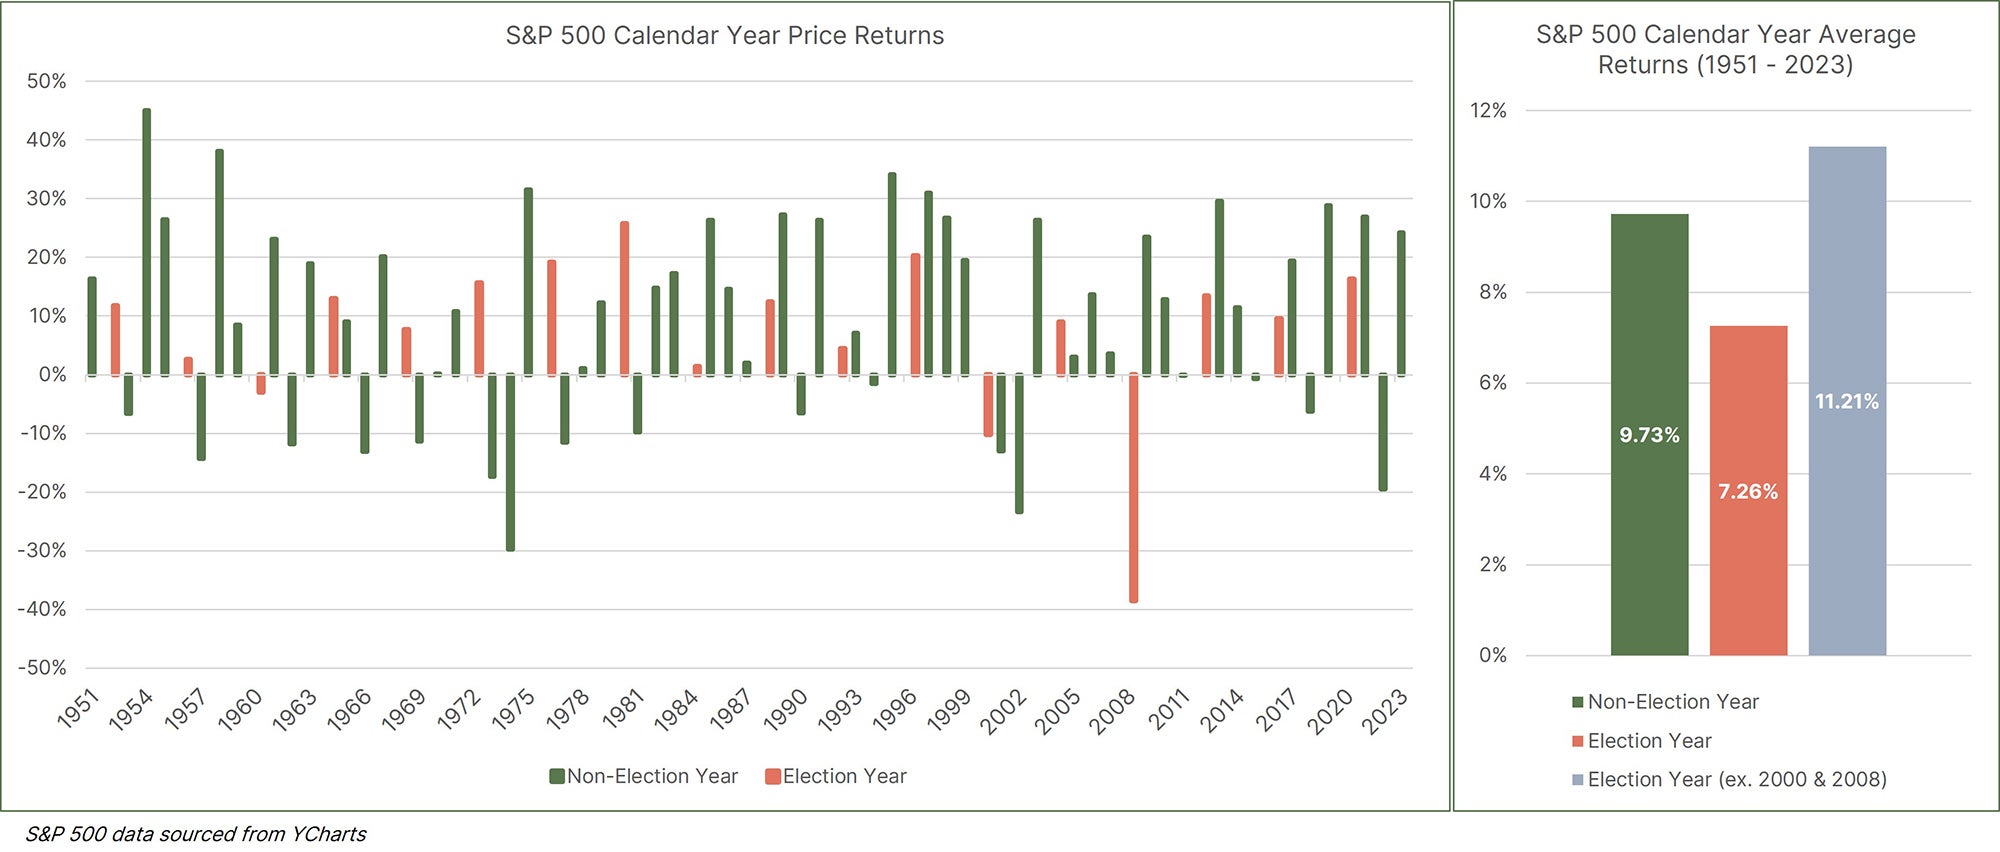
The natural takeaway might be that election years tend to provide lower returns, and that is an understandable conclusion given those two figures. However, proper data analysis doesn’t take things at face value. When we look more critically, we see that of the eighteen election years, there are three periods of negative returns, which are 1960 (-2.78%), 2000 (-9.78%), and 2008 (-38.49%). We would argue that the Dot Com Tech bubble of 2000 and the Great Financial Crisis of 2008 were fundamental reasons that drove stock prices lower, and not the results of the election. When labeling these tail risk events as outliers and removing them from the data, the average annual return during an election year jumps to 11.21%, far outpacing the average annual return of non-election years of 9.73%. What’s our conclusion to this data? Investors are more often than not, better suited to stay the course and not deviate from long-term portfolio allocations.
We just looked at calendar year returns, but now let’s narrow our focus and look at the 90 days immediately before and after election day. Uncertainty around the outcome of the election must lead to an increase in volatility in the stock market and potentially harm returns, right?
Looking at the next chart provided, the S&P 500 tends to have both positive and negative price fluctuations in the 90 days leading up to election. Including the two tail risk events of 2000 and 2008, the average S&P 500 experience, as shown by the dotted black line, is actually relatively unchanged. This may be surprising to many, but certainly confirms our observations through experience as the market is really in a “wait and see” period.
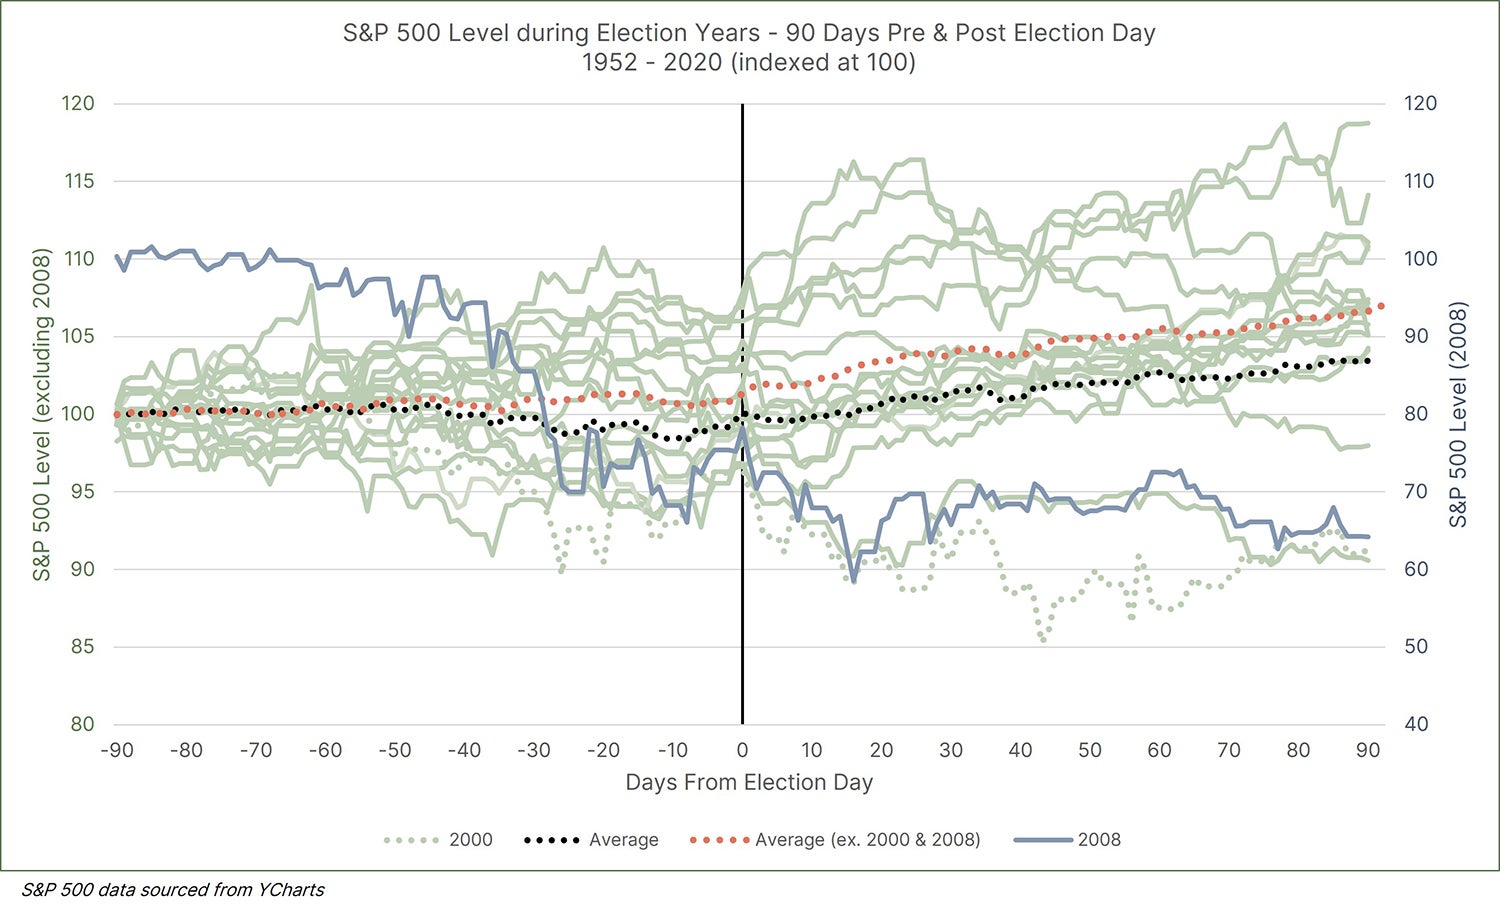
On the other hand, the data in the 90 days following the election is quite interesting. As the right-hand side of the chart indicates, during the 90 days post-election the market tends to rally and generate positive returns into the next calendar year. We would argue that this phenomenon is not the market approving of the election (remember the market is bipartisan), but the result of being freed by the tether that is uncertainty.
Again, highlighting the importance of separating fundamental data from “market noise,” two of the years with negative returns post-election day were 2000 (dotted green line) and 2008 (blue line and right axis). Both years were negative heading into the election because of the economic backdrop and continued that negative momentum in the 90 days post-election day. Excluding those two years, as displayed by the dotted red line, the S&P 500 on average is slightly positive in the 90 days leading up to election day and even higher in the 90 days after election day.
In conclusion, markets do not like uncertainty and Presidential election cycles tend to be periods of great uncertainty that can incite understandable investor trepidation. However, we would encourage investors to look past the political rhetoric and remember that long term performance of the stock market tends to represent economic and corporate fundamentals, not the political party in the White House or Congress. Staying disciplined by focusing on long-term objectives and remaining committed to a diversified portfolio is likely the most prudent approach. Our message: Stay the Course.
Diversification does not assure a profit or protect against loss in declining markets, and diversification cannot guarantee that any objective or goal will be achieved.
Authored by:
Alex Bartholomew, AIF®, Sr. Vice President and Chief Investment Officer
Kyle Cornell, AIF®, Director of Research and Trading