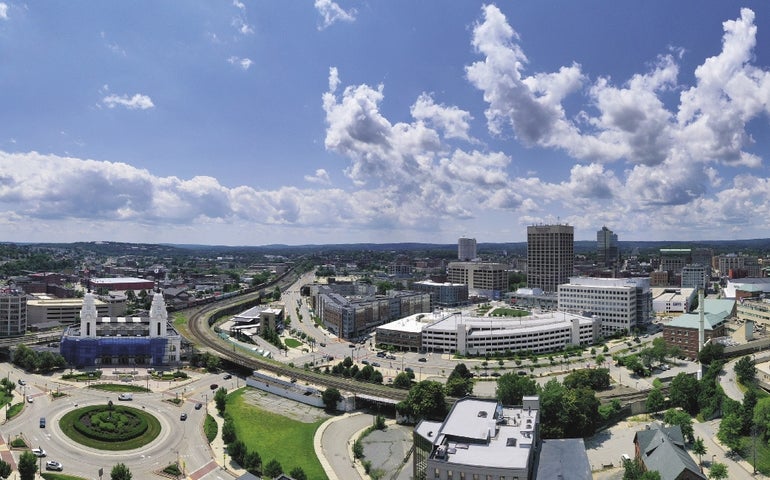
The Greater Worcester economy appears to finally be outperforming its national and New England peers in key areas, although struggles in the city itself put it near the back of the pack compared to other Massachusetts Gateway Cities.
Last summer, a WBJ analysis found during the longest sustained period of economic growth in U.S. history where developments are trending toward urbanization, the economy of the Greater Worcester metropolitan region lagged significantly behind U.S. metro areas of similar size and New England’s other major cities, showing the much ballyhooed Worcester renaissance was largely buzzy talk with little substance.
In an update of that WBJ study this year, the results show Greater Worcester is starting to make up the ground it lost from being behind the pack since the end of the Great Recession, by outpacing its national and regional peers in each of the last two years. Like last year, WBJ is using the U.S. Census Bureau definition of the Greater Worcester metro area, which includes Worcester County and Windham County, Conn.
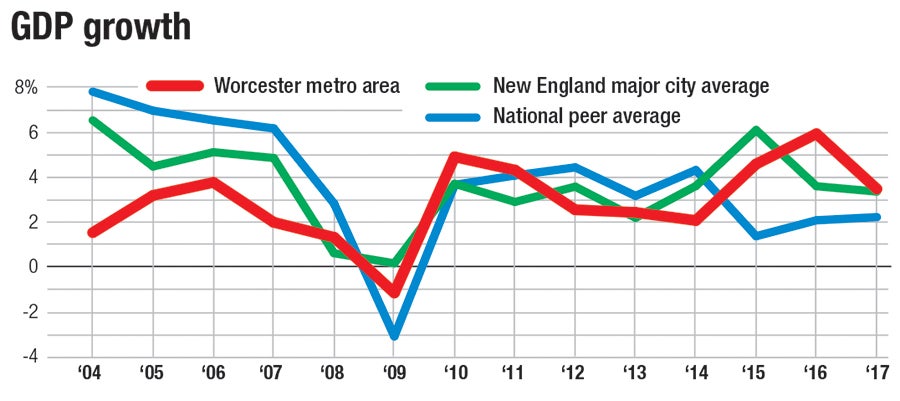
Among the biggest steps forward is the region’s gross domestic product – GDP, a measure of the size of the area’s economy – has averaged 4.7% growth annually in the past three years, doubling the growth rate of the previous three years.
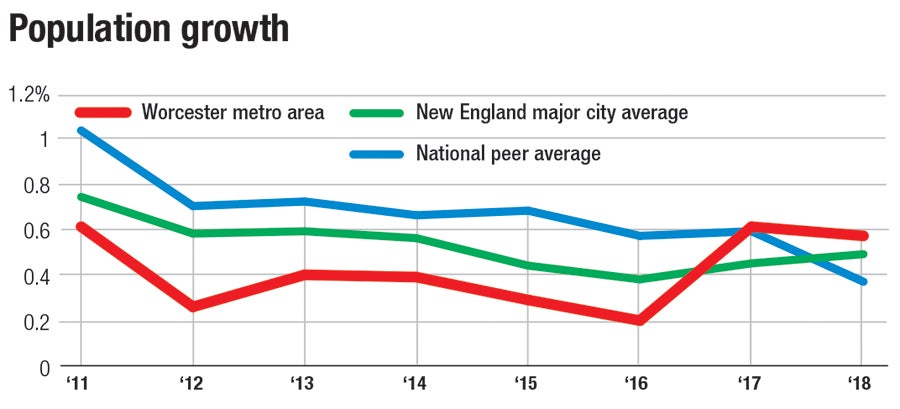
Population growth – which still lags national and state rates since 2010 – has picked up, beating national and regional peer areas in each of the last two years, rising 3.4% this decade.
In all, WBJ analyzed Greater Worcester in 25 economic indicator categories against the 10 U.S. metro areas with the most similar populations: Albany, N.Y.; Bridgeport, Conn.; Greenville, S.C.; Tucson, Ariz.; Tulsa, Okla.; Omaha, Neb.; Albuquerque, N.M; Bakersfield, Calif.; Fresno, Calif.; and Honolulu, Hawaii. In a separate comparison, WBJ measured Greater Worcester against the other major New England metro areas: Boston, Providence, Springfield, Hartford, Manchester, N.H. and Portland, Maine.
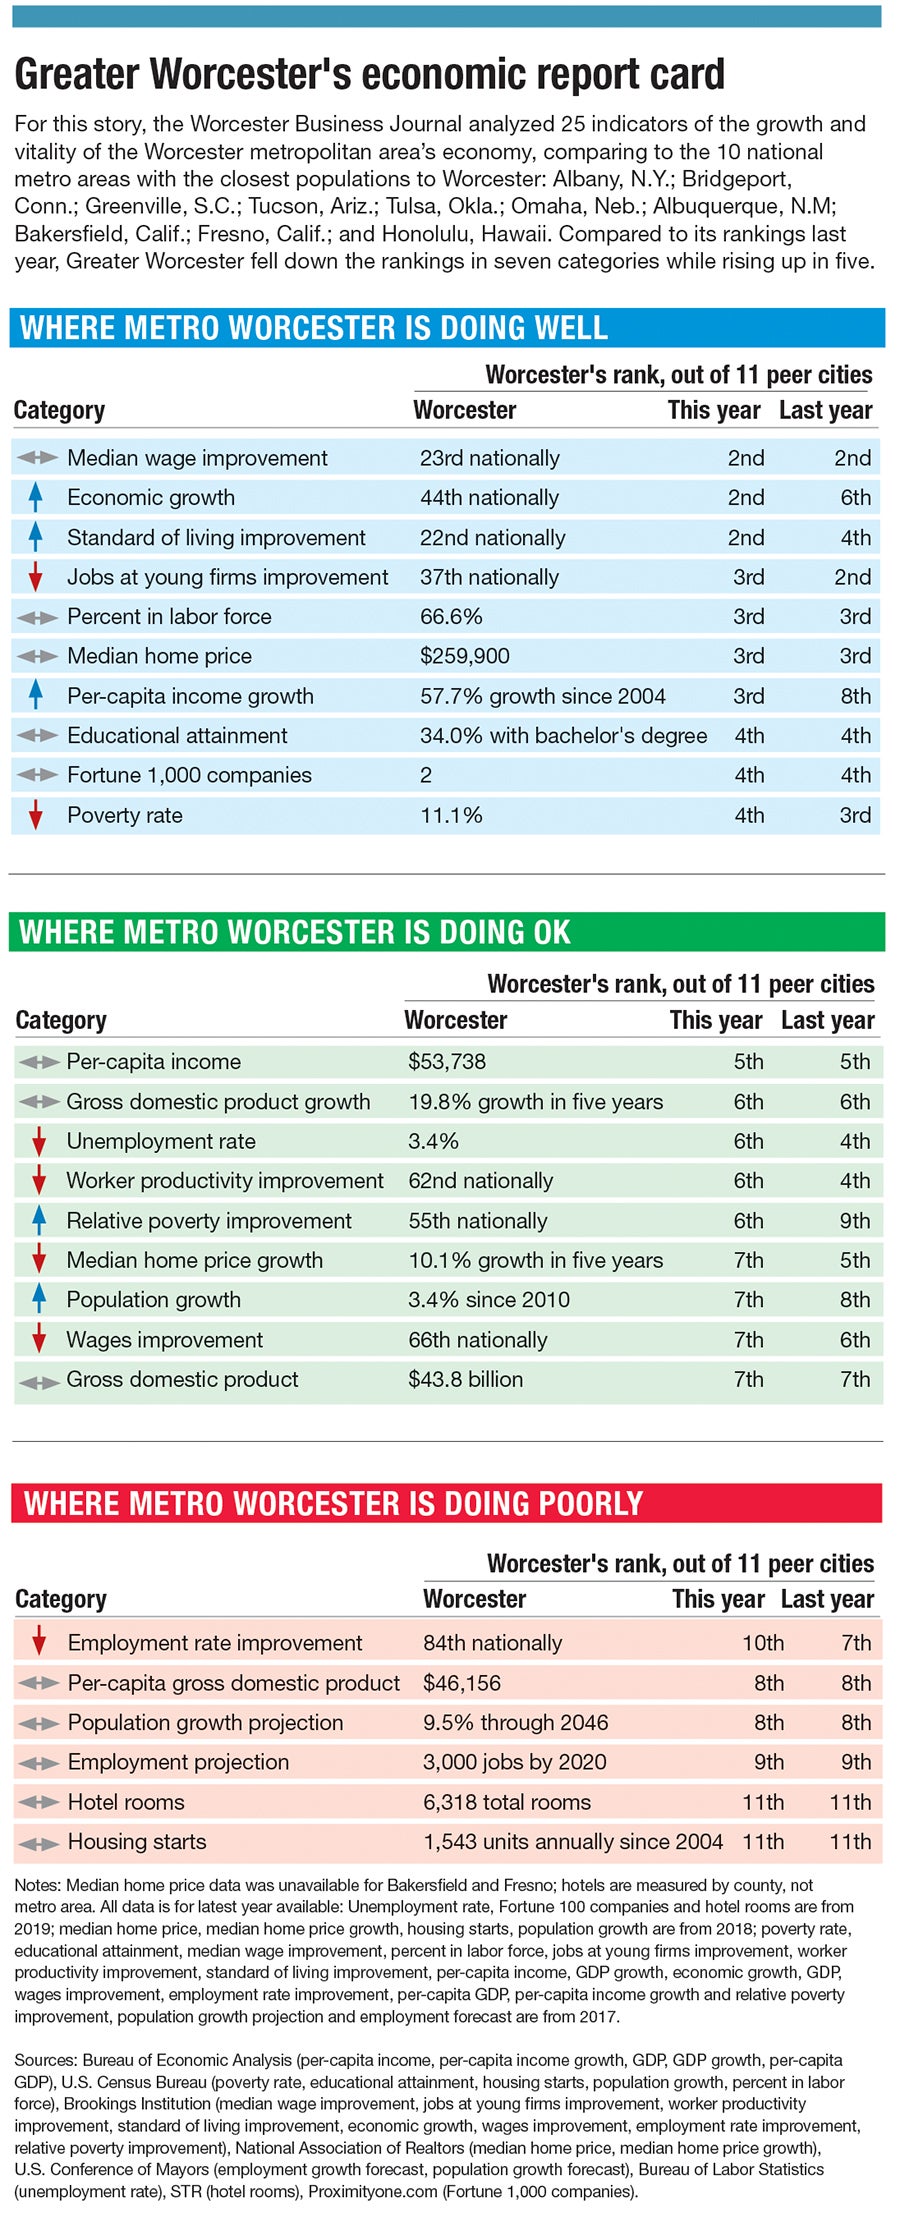
Although the whole of the 25 metrics in this Greater Worcester Economic Report Card show a complex regional economy excelling in certain areas (quality of life, home prices) and trailing in others (housing starts, job growth) compared to its national peers, key metrics like population, GDP and income growth say the Greater Worcester economy is finally starting to catch up.
“Worcester has been said to be on the rise for years without a dramatic change to prove it,” Boston think tank MassINC said in an August 2018 report.
New to study this year is an effort to further understand the economic growth within the region, so WBJ compared data exclusively inside the city of Worcester against the 25 other Massachusetts Gateway Cities. That analysis looking strictly at what is going on economically within city limits shows Worcester city below average in 13 of the 17 categories, ranking last or near last for metrics like household income, poverty rate, labor force participation and changes in the per square foot price of homes.
While the city of Worcester has had a handful of high-profile successes such as the opening of the 145 Front at City Square apartments and convincing the Pawtucket Red Sox to move to a $101-million municipal stadium in the Canal District in two years, their impact hasn’t yet trickled down to key economic indicators and may even mask more complex problems in the city.
“The publicity of large openings, whatever they might be, might not be indicative of the underlying conditions of the city,” said Robert Baumann, an economics professor at the College of the Holy Cross in Worcester.

Per-capita income growth, too – a measure of how much wealth is flowing into the region and a sign of how many consumer-facing establishments like restaurants and retail the community can support – took a big leap forward from last year, ranking third among national peers (up from eighth last year), as the metric has risen 58% since 2004.
These metrics show Greater Worcester has picked up steam in the most recent years, but because the region has lagged behind for so long, its economy is simply making up for lost time, rather than setting the pace.
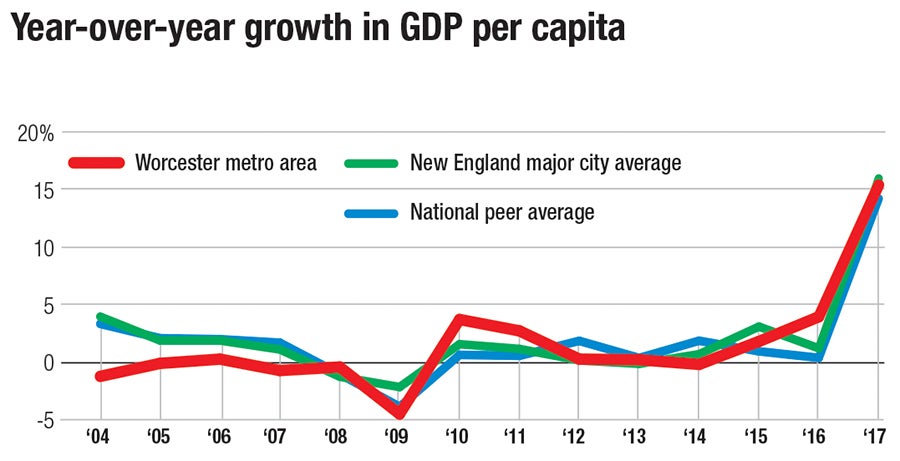
Per-capita GDP – a measure of economic output relative to population size – has grown 20% in Greater Worcester since 2003, behind the averages of its national peers (25%) and the other New England major metro areas (30%). In fact, Worcester ranked last among all the national peers and behind the other six New England major metros in per-capita GDP.
Other areas of concern include:
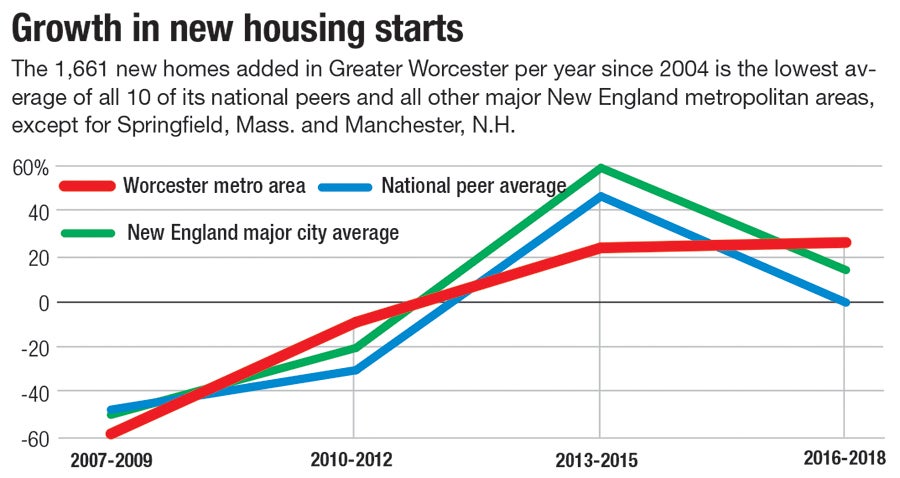
• Greater Worcester remains last in housing starts and in improvement in its employment rate.
• The region’s median home price still trails its pre-recession peak by 10%. Meanwhile, the Massachusetts statewide median home price has regularly hit record highs, including most recently in June.
• The value of construction starts, a measurement of new commercial and residential growth, were lower in Worcester County in 2018 than at any time since 2014, and lower than 2009, during the depths of the Great Recession, according to the firm Dodge Data & Analytics.
Last to the party
In comparing Greater Worcester to its national peers, most significant is the region’s economic growth, ranked second of the 11 peers and good enough for 44th of all U.S. metro areas nationally. Last year, Greater Worcester was sixth among national peers in that category.
Boston and its more immediate suburbs have benefited about as well as any region nationally since the recession, but other areas of Massachusetts have often been the last to benefit from an economic expansion, said Ben Forman, MassINC’s research director.
This could be a significant problem if the region and the nation start to head into another recession, as places like Greater Worcester, which were the last to benefit from the economic recovery, are less equipped to handle the downturn.
While big commercial developments may be announced now when the economy is riding high, projects sometimes begin only for momentum to stop when the financials stop adding up during an economic downturn, Forman said.

And signs of that economic slowdown may already be showing themselves.
The Worcester Economic Index, a quarterly review of Greater Worcester’s economic metrics – primarily employment growth – by Assumption College professor Thomas White, has shown an economic contraction through the first half of 2019.
White said he still forecasts slow but positive growth for Greater Worcester, based on consumer confidence and a still-rising stock market.
But the national GDP slowed in the second quarter as well, and Greater Worcester is lagging behind that growth, White said.
“My numbers say that the Worcester numbers are falling a little bit faster,” White said.
Worcester city vs. Gateway Cities
Looking strictly at metrics inside the city of Worcester compared to other Massachusetts cities in similar situations, the local economy appears to have quite a bit of catching up to do.
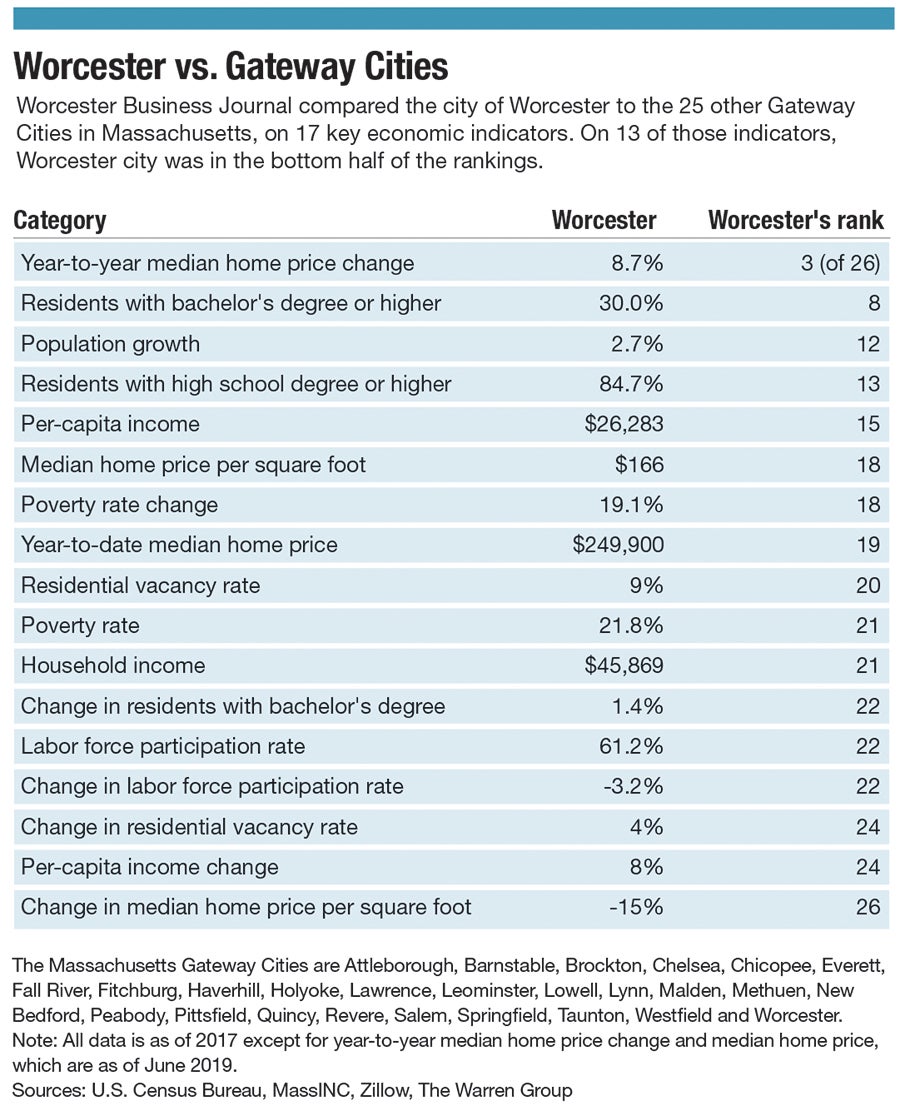
Compared to the other 25 Gateway Cities in the Bay State, Worcester outperforms more than half of them only in population growth, percent of residents with at least a bachelor’s degree, and improvement in median home price. For 13 other metrics WBJ analyzed, Worcester was below average.
Of the 26 Gateway Cities, only two (Springfield and Lowell) have populations near Worcester’s 185,877, which is first. Therefore, the smaller cities aren’t going to have the same larger-scale challenges as a city the size of Worcester.
Still, the Gateway Cities are grouped together by the state because of their higher rates of immigrants, with common economic challenges, and the Gateway City ranking offers insight into each’s economy has adjusted to these problems.
Among the areas of concern for Worcester city:
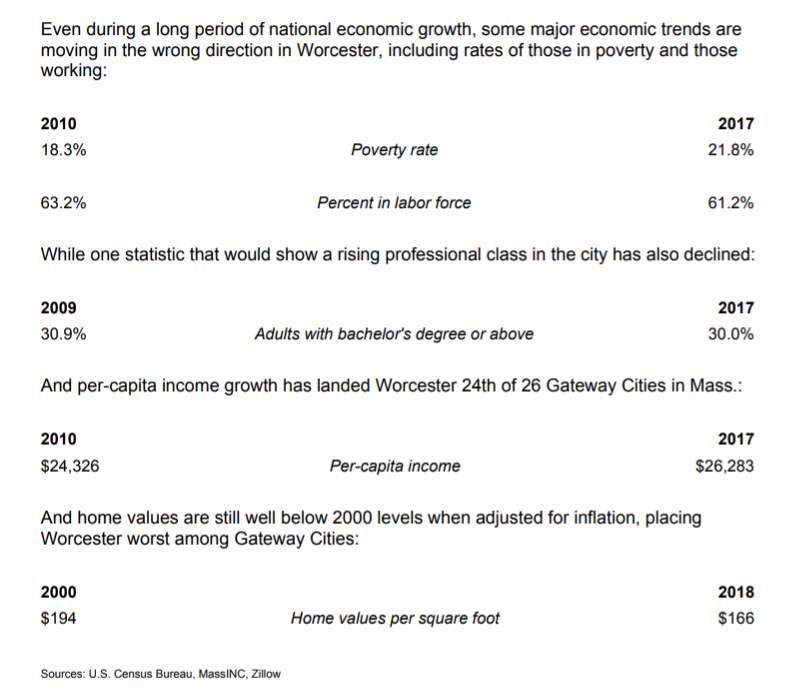
• Worcester city lands last among 26 Gateway Cities for median home price values, which have dropped 15% since 2000 when adjusted for inflation.
• The labor force participation rate has shrunk slightly since 2010, even as unemployment rates have dropped to some of the lowest numbers in generations.
• The rate of residents with bachelor’s degrees or above, a sign of professionals moving into the city, is largely flat since 2010, landing it 22nd of Gateway Cities.
Worcester’s poverty rate of 22% has increased since 2010 and ranks 21st among Gateway Cities.
In fact, Worcester’s rate of homeless elementary and high school students is fifth highest among all U.S, cities, with more than 3,000 homeless in Worcester Public Schools, according to a study of U.S. Department of Education data.
The child poverty rate in Worcester city grew from 26.0% to 31.2% from 2010 to 2017.
The new planned residential projects in Worcester city may simply shift around residents more than attract new ones, Baumann said, while projects such as the Worcester Red Sox stadium are bound not to benefit residents further down the economic ladder.
“Those great and wonderful things are usually done for the middle or those on the way up,” Baumann said.
Developments in Worcester often still require subsidies to be feasible.
Larry Curtis, the president and managing partner of WinnDevelopment, the creators of Canal Lofts and Voke Lofts, spoke at an event in Boston in April to help rally investment in Worcester, but acknowledged Worcester projects still need government subsidies to be feasible for a developer.
Common struggles hold Worcester back
Forman, the MassINC research director, said cities like Worcester have suffered from a lack of financial support for neighborhood improvements like new roads, sidewalks or streetlights. These types of efforts used to be paid for by a combination of local, state and federal governments.
“The resources just aren’t there to do the neighborhood work,” Forman said. “This is not necessarily a Gateway City-only problem.”
In Worcester, state funding has helped pay for renovating the former Worcester County Courthouse in Lincoln Square into more than 100 affordable apartments. Roughly $50 million will go toward remaking Kelley Square in the Canal District and building a parking garage for a mixed-use project across from the baseball stadium.
But, Forman said, very little money helps homeowners fix up the city’s countless triple-deckers or replacing cracked sidewalks or potholed roads, for example.
Instead, he said, money is more likely to go toward larger projects with a perceived greater efficiency. Mixed-use downtowns are more likely to receive funding than less-dense residential neighborhoods.
“There’s always that dichotomy,” Forman said.
